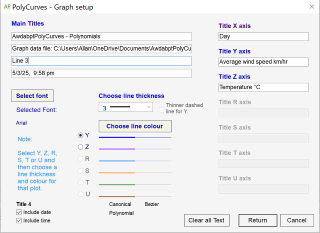
AwdabptPolyCurves is a computer program for the production of graphical curves utilising best fit polynomials, splines and smoothing splines.
Interpolation is provided for the polynomial curves and for the smoothing splines. The user may adjust knots in the generation of the smoothing splines
Up to six variables may be considered. It has been developed as an analytical and design aid.
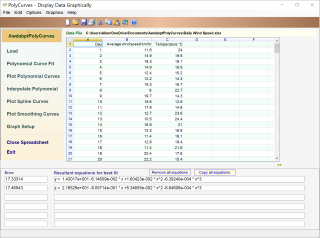
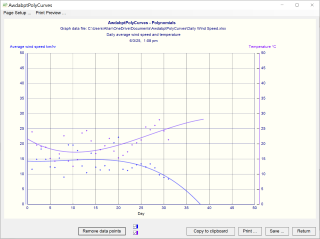
• The data file containing the plot data may be either a text file or a compatible spreadsheet file (.xlsx, .xls or .csv).• When it is required to have a theoretical curve, produced by a suitable equation, that best fits the actual data, then polynomial regression may be used to derive that curve, ie. find a mathematical relationship between the independent variable and the dependent variable(s).
• Spline curves are composite curves created using polynomial sections. The curves are defined by control points that for us are our data points. So we are just joining together multiple curves instead of trying to generate a single polynomial curve.
• Spline regression involves grouping the data along the independant axis into small groups for which individual theoretical curves are derived such that the curves join together nicely with the neighbouring data group curve on each side.
• The individual curves are typically based on second or third order polynomials, though straight lines can be used but they provide a jagged overall graph. In otherwords, one theoretical equation does not represent or model the complete data set.
• So spline regression is a non-linear regression type that, as an alternative to linear and polynomial regression algorithms, introduces some benefits and some difficulties. In those regression types, the entire dataset is considered at once.
• Spline regression divides the dataset into data point bins whose boundaries are identified data points referred to as knots. Those knots will be your choice in the Smoothing Curve option.
• Smoothing splines
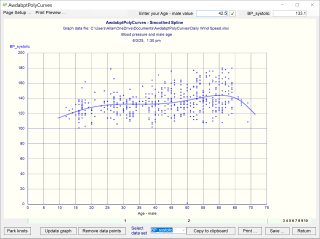
AwdabptPolyCurves includes the ability to generate a spline curve that moves through a large data set that can include a number of points of differing values of Y at the same independent variable, X.
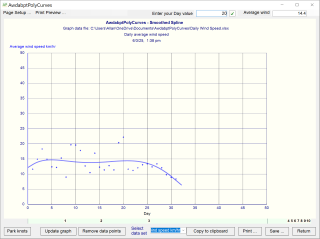
The option is provided to position knots on the X axis in order to define segments of the curve such that each segment is an individual Bézier spline.
The default number of knots is two. Knots should be positioned to generate a curve that suits your expectation given the nature of your data set.

